
Partial Least Square (PLS) regression is one of the workhorses of chemometrics applied to spectroscopy. PLS can successfully deal with correlated variables (wavelengths or wave numbers), and project them into latent variables, which are in turn used for regression. While arguably the most popular, regression is not the only application of PLS. Specific algorithms to deal with categorical (discrete) variables have been developed for PLS. This kinds of algorithm are grouped under the name of PLS Discriminant Analysis (PLS-DA).
In this tutorial we are going to work through a binary classification problem with PLS-DA. In doing so, we’ll have the opportunity to look at PLS cross-decomposition under a different light, which I hope will help broaden the understanding of the wider decomposition (or cross-decomposition) approach to deal with multicollinearity.
A quick recap of PLS
To start off, let’s refresh the main philosophy behind PLS regression. For introductory tutorial on PLS in Python you can check our other posts:
PLS is at heart a dimensionality reduction technique. Just like PCA, it realises a coordinate transform. Spectra, initially a function of wavelength (or wave number), are transformed to become functions of generalised coordinates called principal components (or, more correctly, latent variables in PLS).
This is a key concept: there is no way around some sort of decomposition when dealing with spectral data. All spectra, from the point of view of a machine learning model, suffer from multicollinearity problems. Multicollinearity in a spectrum means that the signal at one wavelength is (somewhat or highly) correlated with the signal at neighbouring wavelengths. This correlation makes the mathematical problem of solving a least square regression ill-posed. In practice this means you can’t simply run a linear least square regression on the raw spectra, as the algorithm will fail (Note you can however modify the linear regression to introduce a regularisation of the least square problem. An example is the Ridge regression, but there’s more).
A dimensionality reduction transformation takes away the multicollinearity. The principal components are independent from one another and can be used together to run a regression. There are a number of techniques to achieve dimensionality reduction (take a look here for an overview). PLS and PCA are two of them.
Unlike PCA, PLS is a cross-decomposition technique. It derives the principal components by maximising the covariance between the spectra and the response variable (PCA on the contrary is based on minimising the covariance between the different spectra, without looking at the response variable). Therefore PLS will ensure that the first few principal components have a good degree of correlation with the response variable. This fact alone is arguably the reason why PLS is generally very successful in building calibration models in spectroscopy: in one swift operation, PLS can accomplish both dimensionality reduction and good correlation with the response.
Now, PLS has been originally developed for (and mostly lends itself to) regression problems. Other dimensionality reduction techniques – such as PCA or LDA – are often/always used for classification. While being a dimensionality reduction technique itself, PLS is not generally applied to classification problems in the same way. Here’s a few reasons for that.
- PCA decomposition doesn’t require the knowledge of the response variable. It therefore lends itself to both regression and classification problems, the latter in supervised or unsupervised fashion alike.
- LDA decomposition is specified only for categorical response variables. It is therefore naturally applied to (supervised) classification.
- PLS decomposition is inextricably linked to the response variable which is usually a continuous variable. PLS predictions therefore belong to a continuum, which is another way of saying that PLS is naturally applicable to regressions.
A variation of PLS to deal with categorical variables however has been developed. The technique – or the class of techniques – is called Partial Least Square – Discriminant Analysis, PLS-DA. This class of techniques has been developed to answer the question: “What happens if we use categorical (numerical) response variables as input to a PLS decomposition?
Combining PLS and Discriminant Analysis
To give an answer to this question, let’s look at the general structure of a PLS-DA algorithm. We’ll work through a classification problem using NIR data in the next section.
The logical structure of PLS regression is very simple:
- Run a PLS decomposition where the response vector contains real numbers
- Run a linear regression on the principal components (or latent variables) obtained in the previous step.
In fact this structure is exactly the same as the one used in PCR, where principal component analysis is done in place of PLS cross-decomposition.
Then, simply enough, PLS-DA is done with a modification of the previous steps as follows:
- Run a PLS decomposition where the response vector contains integer numbers
- Instead of using the components as input to a linear regression, we use them as input to a classification problem.
Let’s slow down for a second and repeat that again. The problem we are addressing is a binary classification. We have two classes of samples and we want to build a model that separates the samples in their respective classes on the basis of their infrared spectrum. The PLS-DA approach is to run a PLS cross-decomposition on the spectra, then run a (supervised) classification problem using the categorical variables (classes) as training variables.
This last step is generically called “Discriminant Analysis”, but in fact it is not a specific algorithm. Once the PLS cross-decomposition is done, there may be several ways to do a discriminant analysis. The best way is in general dependent upon the problem at hand, and requires the user’s judgement.
This is perhaps the stickiest point of this whole DA business, and requires a few more words of explanation. The categorical variables are generally mapped to integer numbers. So, if we have a binary classification, we can associate the values 0 and 1 to the classes. Then we take our training set and run a PLS cross-decomposition. Once the model is built on the training set, we can apply it to predict the class of a test spectrum. The result will be, in general, a real number that is neither 0 or 1.
The fact is that there is no condition in the PLS algorithm that constraints the output to be integers, regardless of the response variable. PLS was developed for continuous regression problems, and this fact keeps being true even if the variables are categorical. Sure enough, if the model is good, the test result will be close to either 0 or 1, but won’t generally be a match.
Therefore one has to decide the best way to cluster the non-integer outputs so that they can be correctly assigned to a specified class. As mentioned, this step requires the judgement of the user, as there may be many ways to accomplish it.
I hope that gives you an idea of the issue. Following the example in the next section, we’ll give an option for discriminant analysis using thresholding.
PLS-DA for binary classification of NIR spectra
The data set for this tutorial is a bunch of NIR spectra from samples of milk powder. Milk powder and coconut milk powder were mixed in different proportions and NIR spectra were acquired. The data set is freely available for download in our Github repo.
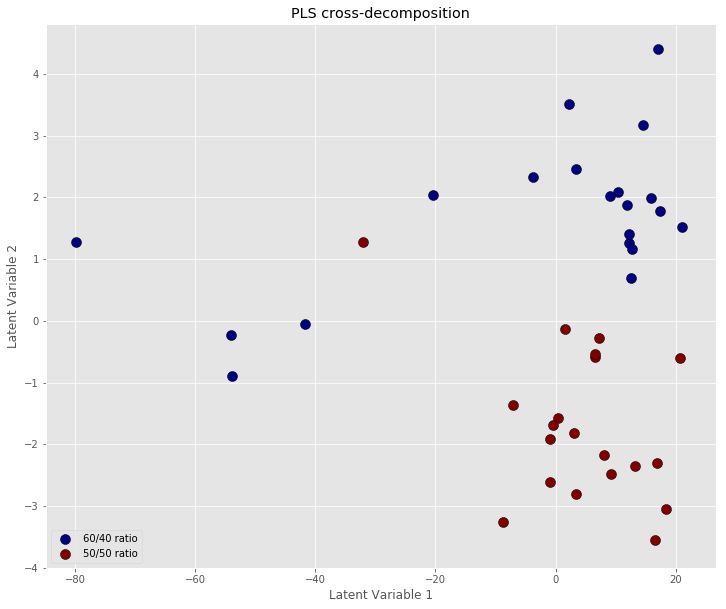
The data set contains 11 different classes, corresponding to samples going from 100% milk powder to 0% milk powder (that is 100% coconut milk powder) in decrements of 10%. For the sake of running a binary classification, we are going to discard all mixes except the 5th and the 6th, corresponding to the 60/40 and 50/50 ratio of milk and coconut milk powder respectively.
Here’s the list of the imports
|
1 2 3 4 5 6 7 8 9 |
import numpy as np import pandas as pd import matplotlib.pyplot as plt from scipy.signal import savgol_filter from sklearn.cross_decomposition import PLSRegression from sklearn.model_selection import KFold, cross_val_predict, train_test_split from sklearn.metrics import accuracy_score |
Next, we load the data, extract the first and the last label, and do some cleaning and preprocessing steps
|
1 2 3 4 5 6 7 8 9 10 |
# Load data into a Pandas dataframe data = pd.read_csv('../data/milk-powder.csv') # Extract first and last label in a new dataframe binary_data = data[(data['labels'] == 5 ) | (data['labels'] == 6)] # Read data into a numpy array and apply simple smoothing X_binary = savgol_filter(binary_data.values[:,2:], 15, polyorder = 3, deriv=0) # Read categorical variables y_binary = binary_data["labels"].values # Map variables to 0 and 1 y_binary = (y_binary == 6).astype('uint8') |
Now it’s time for the actual PLS decomposition, which is as simple as
|
1 2 3 4 |
# Define the PLS regression object pls_binary =PLSRegression(n_components=2) # Fit and transform the data X_pls = pls_binary.fit_transform(X_binary, y_binary)[0] |
Let’s now plot the result, making sure we keep track of the original labels
|
1 2 3 4 5 6 7 8 9 10 11 12 13 14 15 16 17 18 19 |
# Define the labels for the plot legend labplot = ["60/40 ratio", "50/50 ratio"] # Scatter plot unique = list(set(y_binary)) colors = [plt.cm.jet(float(i)/max(unique)) for i in unique] with plt.style.context(('ggplot')): plt.figure(figsize=(12,10)) for i, u in enumerate(unique): col = np.expand_dims(np.array(colors[i]), axis=0) xi = [X_pls[j,0] for j in range(len(X_pls[:,0])) if y_binary[j] == u] yi = [X_pls[j,1] for j in range(len(X_pls[:,1])) if y_binary[j] == u] plt.scatter(xi, yi, c=col, s=100, edgecolors='k',label=str(u)) plt.xlabel('Latent Variable 1') plt.ylabel('Latent Variable 2') plt.legend(labplot,loc='lower left') plt.title('PLS cross-decomposition') plt.show() |
Prediction model by thresholding
So far we have only accomplished dimensionality reduction by PLS cross-decomposition. To produce an actual classification model, we need to obtain binary predictions. Let’s work through this problem using a simple test-train split.
|
1 2 3 4 5 6 7 8 9 10 11 12 |
# Test-train split X_train, X_test, y_train, y_test = train_test_split(X_binary, y_binary, test_size=0.2, random_state=19) # Define the PLS object pls_binary = PLSRegression(n_components=2) # Fit the training set pls_binary.fit(X_train, y_train) # Predictions: these won't generally be integer numbers y_pred = pls_binary.predict(X_test)[:,0] # "Force" binary prediction by thresholding binary_prediction = (pls_binary.predict(X_test)[:,0] > 0.5).astype('uint8') print(binary_prediction, y_test) |
Remember: a simple prediction straight from the fit doesn’t yield integers numbers. A simple way to force the model to produce binary results, is to threshold the ‘raw’ prediction. In this case, since the binary values are 0 and 1, we set the threshold to 0.5. In this simple example we achieve a good (but not perfect accuracy). The model prints
|
1 |
[1 1 0 1 0 1 0 0] [1 1 0 0 0 1 0 0] |
To be more thorough however, let’s estimate the model quality by cross-validation. We are going to borrow from our tutorial on cross-validation strategies which you can refer to for details on the implementation of the K-Fold cross-validation.
Firstly, we are going to define our basic PLS-DA function
|
1 2 3 4 5 6 7 8 9 10 11 12 |
def pls_da(X_train,y_train, X_test): # Define the PLS object for binary classification plsda = PLSRegression(n_components=2) # Fit the training set plsda.fit(X_train, y_train) # Binary prediction on the test set, done with thresholding binary_prediction = (plsda.predict(X_test)[:,0] > 0.5).astype('uint8') return binary_prediction |
We have incorporated the thresholding step into the function, so to have binary predictions directly in output.
Next, we are going to define a K-Fold cross-validation with 10 splits and iterate through it. At each step we calculate the accuracy score.
|
1 2 3 4 5 6 7 8 9 |
accuracy = [] cval = KFold(n_splits=10, shuffle=True, random_state=19) for train, test in cval.split(X_binary): y_pred = pls_da(X_binary[train,:], y_binary[train], X_binary[test,:]) accuracy.append(accuracy_score(y_binary[test], y_pred)) print("Average accuracy on 10 splits: ", np.array(accuracy).mean()) |
At the last step we get the average of the 10 runs. For this simple example we obtain
|
1 |
Average accuracy on 10 splits: 0.95 |
More specifically, we can print the output of each split:
|
1 |
[0.75, 1.0, 1.0, 1.0, 1.0, 0.75, 1.0, 1.0, 1.0, 1.0] |
This tells us that most of the classification runs give a perfect prediction (accuracy=1) while the accuracy drops in two cases. By looking at the scatter plot above, we may guess that the lower accuracy corresponds to the points near the centre of the plot being included in the test set. These cases are more ambiguous and a simple threshold classification is not able to accurately discriminate between them.
As a side note, if you go back to the pre-processing step and set “deriv=1” the cross-decomposition achieves a better clustering and the classification accuracy will become 1 in all cases.
The aim of this tutorial was to give an easy introduction to the PLS-DA, without diving in too much details about estimating the accuracy of the classification. We’ll leave this to a future post.
Thanks for reading and until next time,
Daniel


