Hi everyone and welcome to a new use case on near-infrared spectroscopy for food analysis. Today we will show how to detect the difference between lactose-free milk and normal milk.
If you are interested in other tutorial on near-infrared spectroscopy for food analysis, feel free to check our other posts on: macadamia and coffee. For technical posts on Principal Component Analysis you can check here and here.
Lactose intolerance and lactose-free milk
Lactose is a sugar naturally present in regular milk. Lactose intolerance is the condition in which a subjects lacks the enzyme lactase in the small intestine. The lactase is responsible for breaking down the lactose into its constituents glucose and galactose.
That was a bit of a mouthful I know. Said in plain language, if we are lactose intolerant, our digestive system can’t process the milk sugar and that causes unpleasant symptoms as bloating, nausea, gas, etc.
Lactose intolerance is not an allergy (milk allergy is a completely different thing) but can be relieved by avoiding the lactose. Dairy-free products do not contain lactose, but there are option such as lactose-free milk that are produced for lactose intolerants.
Lactose free milk is normally produced by ultra-pasteurization of regular milk and by adding the lactase in it. The lactase breaks down the lactose to make the milk lactose-free.
Enters near-infrared spectroscopy
In this tutorial, we will show how we can detect the presence of milk in lactose-free milk or vice versa. In practice, everything else being equal, we are detecting the presence of lactose (+ glucose and galactose) in lactose-free milk, as opposed to the presence of lactose in regular milk.
We prepared different samples starting with 100% milk, and changing the ratio of milk/lactose-free in 1/8 intervals. That means the first sample was 1/8 milk and 7/8 lactose-free milk, the second sample was 2/8 milk and 6/8 lactose-free milk, and so on.
We used our AOTF-NIR spectrometer, mounted on a vertical bracket to scan the samples. We took good care to keep the distance of the spectrometer from the surface of the milk samples to be always the same. In this way we minimised sample-to-sample variations.

We collected 50 scans for each sample, scanning from 1100 nm to 2300 nm with intervals of 2 nm. We collected 50 spectra, each spectrum was in turn the average of 20 individual scans. The spectra are freely available at our Github repo.
For this tutorial we just decided to run a qualitative analysis using Principal Components Analysis (PCA). An introduction to PCA can be found here, and an application of PCA to macadamia nuts classification is available here.
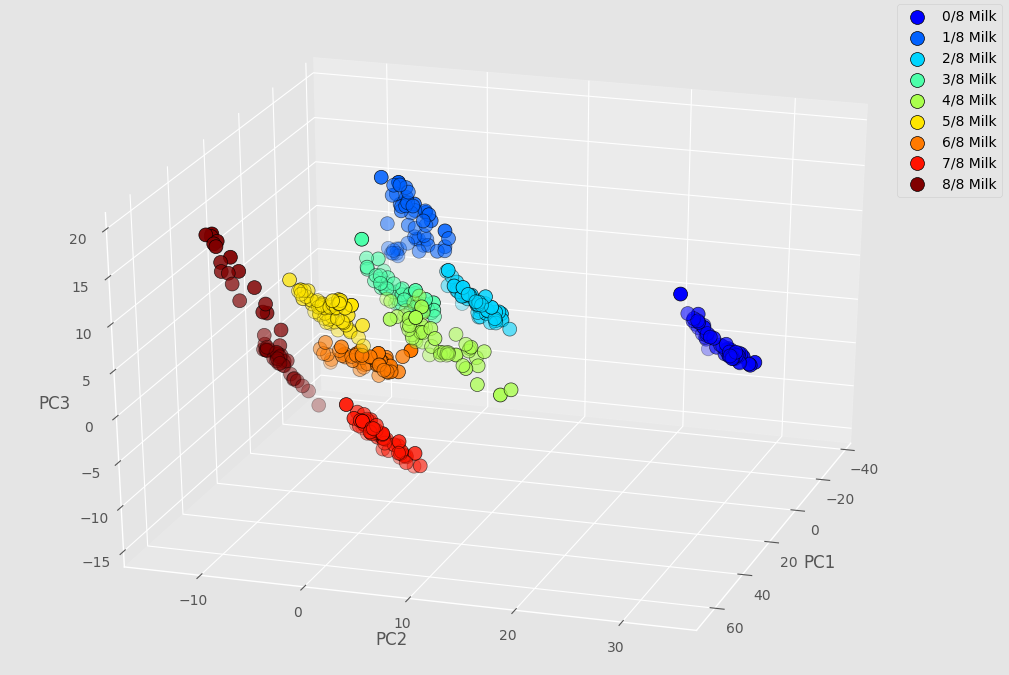
By selecting the first three principal components, which explain most of the variations of the data, we are able to produce a 3D scatter plot of the results.

Each dot in the scatter plot represents an individual scan. The dots are colour-coded according to the (known) sample composition. The purpose of this exercise is to see whether and how well the PCA can cluster apart the measurements of different samples. In other words, how are we able to detect the presence of lactose in lactose-free milk?
Well, here we see that even just 1/8 of regular milk in lactose-free milk is detectable, at least within the limitations of this controlled experiment. The size of the dataset is arguably too limited to make a meaningful classification model, but given the good clustering it seems that each individual 1/8 step in concentration can be quite clearly distinguished.
That’s it for today. As always, thanks for reading and don’t forget to share this content with friends and colleagues! Until next time.
Daniel
Featured image photo by Alexas Fotos on Pexels.


