
Coffee flavour is a very complicated mix of so many different elements: variety, roasting, grinding and brewing all play a unique part in making your perfect cup of coffee. In this post, I’ll discuss how NIR spectroscopy can be used to qualitatively distinguish between different types of ground coffee.
The gist of this post is to apply a Principal Components Analysis (PCA) decomposition to NIR spectra of roasted, ground coffee and visualise the results to evaluate a rough classification. We won’t discuss or compare different classification methods as the results would be of little significance given the small sample size. Rough as they may be however, it’s easy to understand that with little knowledge of the coffee samples one can be a fairly good classification that can have many uses. For instance it may provide a way to quickly detect adulteration, composition, degree of roasting and sensory perception of coffees. Sensory analysis is especially attractive: predicting the taste of the coffee by measuring NIR spectra of beans or ground coffee blends would be an interesting application.
Well, let’s come back to the ground and set ourselves up for a simpler first step: qualitative classification ground coffee based on NIR spectra. For that I decided to use ground coffee of consistent quality (especially milling size) which has been already classified based on flavour strength. I chose Aldi Expressi coffee capsules (I know, I know), which comes in several varieties, each defined by an ‘intensity’ scale. Differences across the scale are due to different degree of roasting, and different coffee variety (Arabica and/or Robusta) as well as country of origin.
Setting up the questions and methodology
We used NIR analysis to try and answer three simple questions:
- Can we distinguish the content of different capsules from one another?
- Can we separate coffees based on caffeine content?
- Can we distinguish coffees based on chlorogenic acids content?
Question number 3 is especially interesting, as chlorogenic acid plays a role during roasting and influence the bitterness and the acidity of the coffee beverage.
OK, that’s the list of all capsule types we used, along with some information we gathered from the Aldi website:
| Name | Intensity | Roast | Variety |
|---|---|---|---|
| Tauro | 5 | Medium | Arabica |
| Renzo | 8 | Medium-dark | Arabica |
| Reggio | 9 | Medium-dark | NA |
| La Spezia | 11 | Dark | Arabica + Robusta |
| Torino | 11 | Dark | Arabica |
| Abruzzo | 12 | Dark | Arabica + Robusta |
| Calabrese | 13 | Dark | Arabica + Robusta |
NIR analysis was done in the wavelength range was 1100-2300 nm with steps of 2 nm. For each sample we took 10 readings, each reading was the average of 20 scans. The data is available at our GitHub repository.
The data collected were reduced by Principal Components Analysis in Python. We chose the first 3 principal components (which we called PC1, PC2, PC3), and plotted the reduced data as a 3D scatter plot. As anticipated, rather than comparing different classification algorithms (data is definitely not sufficient), we just colour-code the decomposed data and look for trends
Data and code examples
Let’s begin with the basic imports and the exploratory analysis of the data.
|
1 2 3 4 5 6 7 8 9 10 11 12 13 14 15 16 17 18 19 20 21 22 23 24 25 26 |
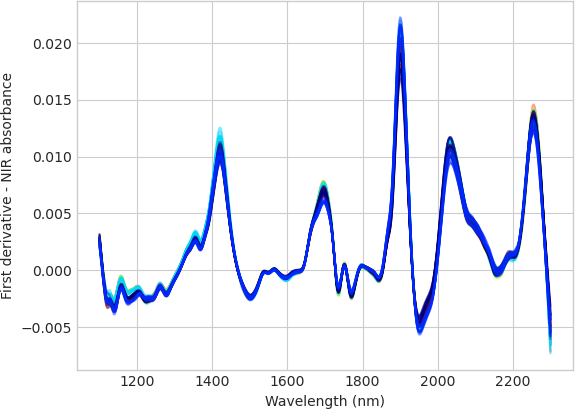
import pandas as pd import numpy as np import matplotlib.pyplot as plt from scipy.signal import savgol_filter from sklearn.preprocessing import StandardScaler, LabelEncoder from sklearn.decomposition import PCA from mpl_toolkits.mplot3d import Axes3D url = 'https://raw.githubusercontent.com/nevernervous78/nirpyresearch/master/data/coffee_classification.csv' data = pd.read_csv(url) labels = data['Coffee Type'] y = LabelEncoder().fit_transform(labels) X = -np.log(data.values[:,1:].astype('float32')) Xc = X - X.mean(axis=0) X1 = savgol_filter(X, 11, polyorder = 2, deriv=1) wl = np.linspace(1100,2300, X.shape[1]) colors = [plt.cm.jet(float(i)/max(y)) for i in y] with plt.style.context(('seaborn-whitegrid')): for i,j in enumerate(colors): plt.plot(wl, X1[i,:], c=j, alpha=0.5) plt.xlabel('Wavelength (nm)') plt.ylabel('First derivative - NIR absorbance') plt.show() |
We plot the first derivative of the absorbance spectra, with this result
Sample code to generate the 3D scatter plot of the PCA coefficients is below
|
1 2 3 4 5 6 7 8 9 10 11 12 13 14 15 16 17 18 19 20 21 22 23 24 25 26 |
# PCA decomposition pca = PCA(n_components=3) Xpca = pca.fit_transform(StandardScaler().fit_transform(X1)) ## 3D Scatter plot unique = list(set(y)) colors = [plt.cm.jet(float(i+1)/(max(unique)+1)) for i in unique] with plt.style.context(('seaborn-whitegrid')): fig = plt.figure(figsize=(10,9)) ax = fig.add_subplot(111, projection="3d") for i, u in enumerate(unique): xi = [Xpca[j,0] for j in range(len(Xpca[:,0])) if y[j] == u] yi = [Xpca[j,1] for j in range(len(Xpca[:,1])) if y[j] == u] zi = [Xpca[j,2] for j in range(len(Xpca[:,2])) if y[j] == u] ax.scatter(xi, yi, zi, color=colors[i], s=80, label=str(u)) ax.view_init(10, 40) ax.set_xlabel('PC1') ax.set_ylabel('PC2') ax.set_zlabel('PC3') plt.legend(labels.unique(),loc='upper left') plt.show() |
The 3D scatter plot will colour-code the data poibts according to the coffee type that is passed with the labels. The plots will look similar to the one reproduced below.
NIR analysis of ground coffee
Question 1: Can we distinguish between capsules?
To answer this question we used the full wavelength range for the PCA analysis, and here’s the result. As you can see, the different coffee types tend to cluster apart, where the medium roasts sit at the right hand side of the chart and the dark roasts towards the left hand side. Difference between individual intensity value is also very clear, representing the underlying difference in compositions.

Question 2: Can we distinguish between caffeine content?
Here we used the 1650-1800 nm band, that according to [1] and [2] contains a strong overtone from the caffeine compound. The measurements from the different capsules spread nicely out following increasing caffeine content. The direction of the arrow comes from the well known fact that the darker roasts contain less caffeine than the lighter roasts.

Question 3: Can we distinguish between chlorogenic acids content?
Here we used the 1400-1600 nm band that, according to the same references cited above, should contain strong signal coming from chlorogenic acids. Sure enough we can see that the darker roasts contain increasing amount of chlorogenic acids, giving the coffee a more bitter and pungent taste.

That’s it for our brief foray into coffee type classification. As anticipated, I avoided any quantitative analysis given the small size of the dataset. The main idea is that NIR analysis is well-placed to provide a quantitative classification of ground coffee types, even with a relatively simple approach. And, of course, the same approach can be used for other classification problems involving NIR spectroscopy.
I hope you found this post useful. Please don’t be shy and share it with friends and colleagues!
Until next time.
Daniel
References


